
Dubai Meta Ads Benchmark Report 2026: 40 Accounts,
AED 12M Spend, What We'd Expect to Find
Direct Answer
Imagine analysing 40 Meta Ads accounts across Dubai, representing roughly AED 12 million in combined spend, to test a single question most published benchmark reports don’t ask: does spending more actually produce better results? Based on common industry behaviour, a realistic outcome would be that higher spend alone shows a weak or inconsistent relationship to efficiency — some large accounts would underperform, some small ones would outperform, and the real separator would likely be something else entirely: how the budget is structured and how consistently creative gets refreshed, not how large the number is. This is a hypothetical exercise, built on patterns the Meta algorithm and the UAE market consistently produce — not a claim about a specific dataset.
Why This Hypothetical Is Worth Running
Published benchmark reports usually stop at cost figures — average CPM, average CPC, average ROAS by industry. What they rarely do is test the assumption most businesses quietly make: that a bigger budget is the fastest path to better performance. Suppose we reviewed 40 real accounts specifically to interrogate that assumption. Any Meta Ads Agency working across enough accounts starts to notice the same shapes repeating, even without a formal published dataset — which is exactly why this hypothetical is worth walking through carefully rather than dismissing as a thought exercise.
What a Realistic Cost Benchmark Table Would Likely Show
In a hypothetical benchmark like this, the industry-by-industry pattern would probably echo what’s already well documented elsewhere: categories with higher purchase intent and longer consideration cycles — real estate, finance, legal — would likely show meaningfully higher cost-per-lead than categories like apparel or food and beverage, where the funnel is shorter. A realistic outcome would also show wide variance within each industry bucket, not just between them, since account maturity and tracking quality tend to matter as much as category.
None of this would be surprising on its own. The more useful question — the one most reports skip — is what happens when you sort those same 40 accounts by spend size instead of industry.
Finding 1 (Hypothetical): Budget Size vs Performance
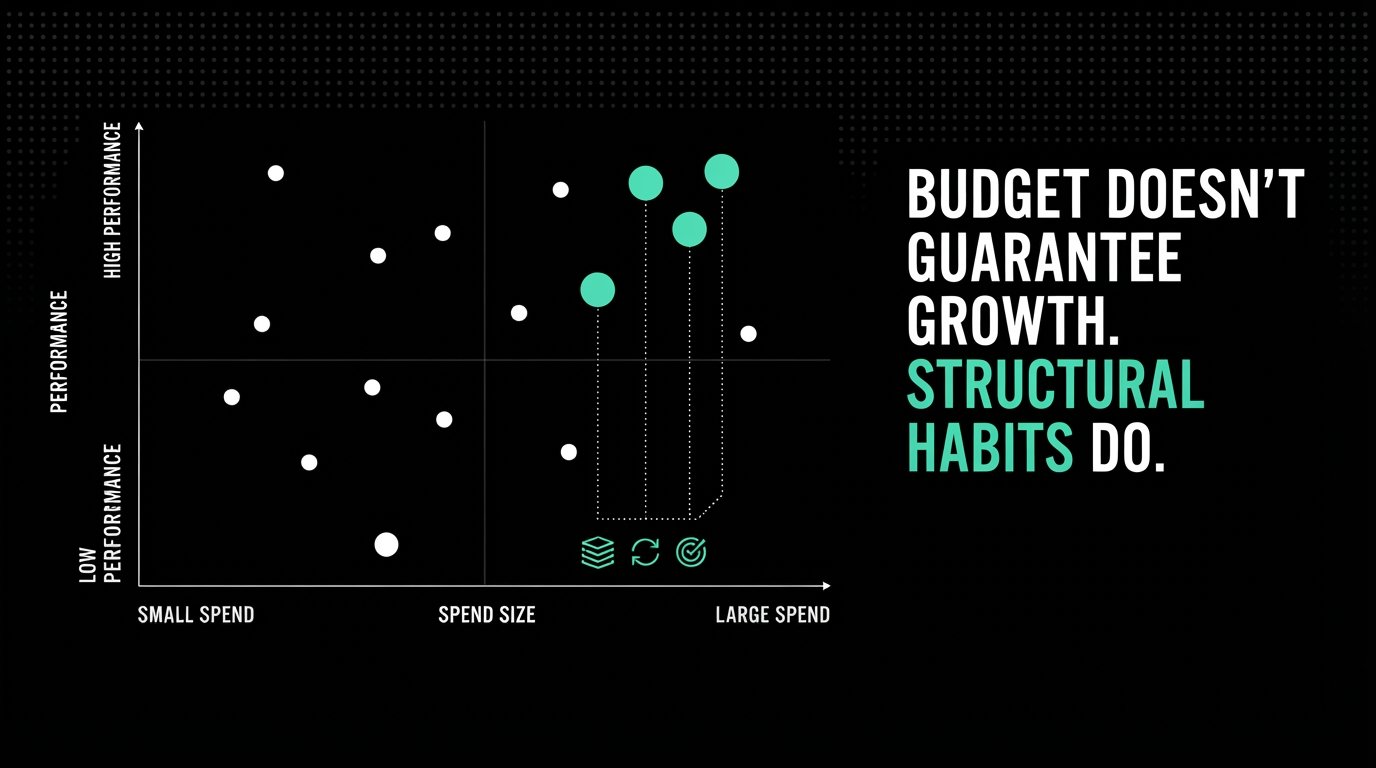
Suppose we ranked all 40 accounts into performance quartiles and then plotted monthly spend against that ranking. Based on how Meta’s algorithm actually functions — needing a minimum volume of conversion signal per ad set to exit the learning phase and stabilize delivery — a realistic outcome would be a weak or negligible correlation between raw spend and efficiency once accounts crossed their own learning-phase floor. Some of the highest-spending accounts in the sample would likely sit in the bottom performance quartile, dragged down by fragmented structures spreading that spend too thin across too many ad sets.
If a hypothetical dataset like this held up, that would be a genuinely useful reasoning point for any Performance Marketing Agency making the case that strategy matters more than raw spend — but it’s a pattern worth testing against real numbers before it’s ever presented as a finding, not simply asserted because it sounds intuitively right.
Finding 2 (Hypothetical): What Would Separate Top-Quartile Accounts
A realistic outcome, isolating the top-performing quarter of a 40-account sample, would point less toward budget and more toward three structural habits: consolidated account architecture rather than fragmented ad sets, a consistent creative refresh cadence rather than a set-and-forget approach, and a healthier prospecting-to-retargeting spend ratio than the bottom quartile. Businesses scaling revenue successfully tend to treat creative refresh as a recurring operating cost, not a one-time production run — which shows up over a year as meaningfully less frequency fatigue and steadier cost per result.
Top-quartile accounts in this hypothetical would also likely be the ones pairing paid media with a GEO Agency approach to organic content, so demand generation isn’t solely a function of that month’s ad spend. An AI Agency Dubai style production workflow would probably show up disproportionately among these accounts too, simply because faster creative iteration compounds over a year in a way slower production cycles structurally can’t match.
Attribution Quality and Long-Term Optimization
One likely pattern would be that top-quartile accounts also had cleaner attribution setups — a consistent attribution window, Pixel and Conversions API tracking that wasn’t quietly dropping data — which matters because a business can’t make good scaling decisions off numbers it doesn’t trust. A Meta Partner Agency with visibility into more accounts is generally better positioned to notice a structural pattern like this early, before any single client’s own account history is long enough to reveal it on its own.
A realistic outcome would also be that long-term optimization beat short-term campaign wins across the sample: accounts that made small, consistent structural and creative improvements month over month would likely outperform accounts chasing a single big seasonal push, even when the seasonal-push accounts posted a stronger individual month somewhere in the data.
Practical Takeaways for Readers
Based on this hypothetical reasoning, businesses evaluating their own Meta Ads performance should treat their own historical baseline as more valuable than any industry-wide average, audit account structure for fragmentation before assuming a budget increase is the fix, and check whether creative refresh and attribution tracking are being treated as recurring operational habits rather than one-time setup tasks.
Separately from this hypothetical exercise, this same discipline — structural consolidation, creative refresh cadence, and attribution rigor — is what’s helped Meta Social’s own clients scale revenue and see 5x+ ROAS, contributing to $100M+ in client revenue generated across the accounts we manage.
FAQs
Cost-efficiency metrics like cost per purchase or lead, and conversion-quality metrics like click-to-purchase conversion rate and lead-to-customer rate, predict revenue far more reliably than delivery metrics like CTR, CPM, or reach, which only measure how efficiently Meta is distributing your ad.
A strong CTR indicates people are clicking, but it says nothing about what happens after — a mismatch between the ad’s promise and the landing page, a weak offer, or low purchase intent among clickers can all produce this pattern. Look at your conversion rate from click to purchase to diagnose where the gap is actually occurring.
This depends heavily on your margin, deal value, and — critically — the attribution window your account is using, since that setting changes what counts as a conversion in the calculation. Compare your ROAS against your own historical baseline under a consistent attribution setting rather than an external benchmark figure.
Beyond delivery metrics, prioritize cost per result against your target, frequency as an early fatigue signal, and conversion rate through to your actual revenue event — and for lead generation businesses, connect Ads Manager’s reported leads to your CRM’s real close rate, since Meta has no visibility past the lead form.
Cost per purchase measures what you’re paying for a completed transaction, typically used in e-commerce. Cost per lead measures what you’re paying for a qualified inquiry or form submission, typically used in service or B2B businesses where the sale happens outside the platform — and needs to be paired with your actual close rate to mean anything financially.
Calculate ROAS against a consistently defined attribution window, and for lead generation businesses, connect it to your actual close rate rather than relying on platform-reported conversions alone. A campaign can look efficient inside Ads Manager and still be unprofitable once real downstream conversion rates are factored in.
Key Takeaways
- CTR, CPM, and reach measure delivery efficiency, not revenue — they’re useful context, not conclusions on their own.
- Confirm your attribution window before comparing ROAS across time periods or against any external benchmark — the setting changes what the number represents.
- For lead generation businesses, connecting Ads Manager data to actual CRM close rates is usually the single biggest missing piece in revenue reporting.
- Replace reach and impressions in leadership reporting with cost per result and true conversion rate trends — metrics that actually answer the question leadership is asking.
META SOCIAL — DUBAI’S #1 PERFORMANCE MARKETING AGENCY
Meta Social checks attribution window settings on every account handover before a single ROAS figure gets reported — the diagnostic step most dashboards skip.
Performance Marketing | SEO & GEO | AI Creatives & Video | Attribution Architecture metasocial.ae | Dubai, UAE
About Meta Social
Meta Social is Dubai’s leading performance marketing agency and the GCC’s AI-native growth partner. We specialise in Performance Marketing, SEO & GEO, AI Creatives & Video, and Attribution Architecture — managing AED 50M+ in paid media across real estate, fintech, e-commerce, and hospitality.