
Meta Ads Cost in UAE 2026: Real CPM, CPC
and CPL Benchmarks by Industry
Direct Answer
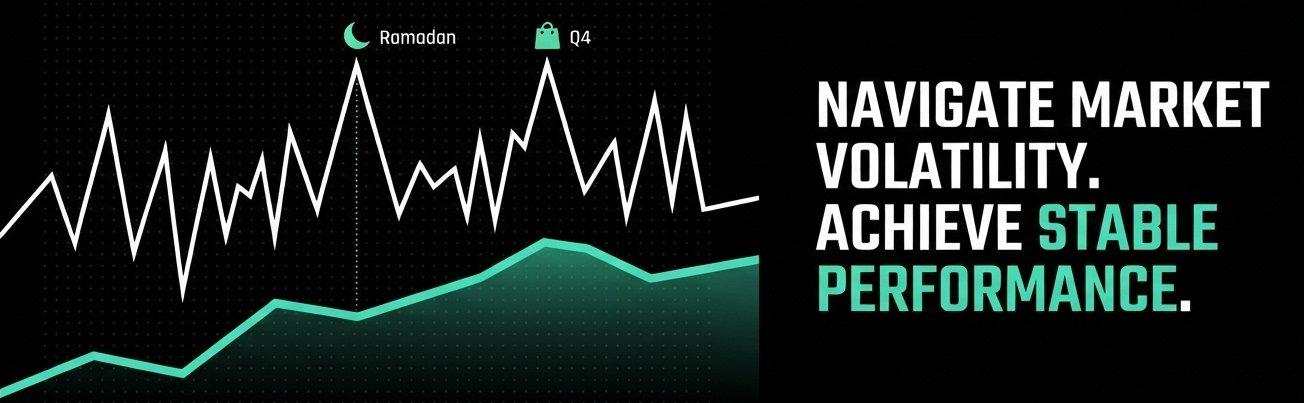
Published Meta Ads benchmarks for the UAE vary widely depending on the source, time period, and methodology — and that variation is itself the most useful data point. Rather than anchoring on a single “correct” number, treat published CPM, CPC, and CPL figures as directional ranges shaped heavily by seasonality, industry, and account maturity. The UAE market shows unusually sharp swings around Ramadan and Q4, driven by concentrated local spending periods. A business obsessing over whether its CPM matches an industry average is often optimizing the wrong variable — the trend inside your own account, and how it moves against your own baseline, tells you far more than a cross-market comparison ever will. At Meta Social, this is the exact discipline behind how we scale client revenue: we build media plans around a client’s own seasonal cost curve rather than a published table, which is part of why accounts under active management tend to stay stable through Ramadan and Q4 spikes rather than getting caught off guard by them.
Why Published UAE Benchmarks Disagree With Each Other
If you’ve read more than one benchmark report on Meta Ads costs in the UAE, you’ve probably noticed the numbers don’t line up — one source puts average CPM in the mid-single digits (USD), another puts it meaningfully higher, and a third shows a wide range spanning both. This isn’t necessarily bad reporting; it usually reflects different account mixes, different placements (Feed versus Reels versus Stories skews the average significantly), and different time windows in a market that moves quickly.
Independent tracking of UAE cost-per-click data across a recent 13-month window found the market to be roughly four times more volatile month-to-month than the global median, with sharp autumn surges and equally sharp spring corrections. That volatility, more than any single average, is the defining characteristic of UAE ad costs right now — and it’s the reason a benchmark published in March can look outdated by June.
A Meta Ads Agency that manages accounts across this market day to day will typically talk in ranges and trend direction rather than fixed figures, because fixed figures rarely survive a full seasonal cycle intact.
What Actually Drives UAE Cost Swings
Two seasonal patterns show up consistently across independent tracking and are worth planning around regardless of which specific benchmark table you’re reading. Ramadan and the surrounding Eid period typically drive a sharp concentration of consumer spending and, correspondingly, advertiser competition
— costs in that window can run meaningfully above the annual baseline, particularly in e-commerce, food and beverage, gifting, and beauty categories. Q4, especially the period around major shopping events, produces a similar effect globally, with the UAE showing an even sharper spike given the concentration of retail and luxury spend in Dubai specifically.
Beyond seasonality, the UAE’s advertiser pool includes luxury and international brands with large budgets competing for the same premium demographic segments that a smaller local business is also targeting — which pushes up costs for everyone bidding into that audience, not just the luxury advertisers themselves. A Performance Marketing Agency operating locally will usually build media plans around these known windows rather than being surprised by them each year.
Industry Variation Matters More Than the Headline Average
Within any published UAE average, the spread between industries is typically far wider than the spread between the UAE and other markets. Categories with high purchase intent and high customer lifetime value — real estate, finance, legal, and healthcare — consistently show higher cost-per-click and cost-per-lead than categories like apparel or food and beverage, where the funnel is shorter and the transaction value is lower. This pattern holds across most credible sources, even when the specific numbers differ.
The practical implication: comparing your CPL in real estate against a blended “UAE average CPL” figure will almost always make your numbers look worse than they are. The only comparison that means anything is against your own category, ideally against your own account’s historical baseline.
How to Benchmark Your Own Account Correctly
Given how much published benchmarks disagree, the more reliable approach is building your own baseline over a full seasonal cycle — tracking your CPM, CPC, and CPL month over month for at least a year so you can see your own Ramadan and Q4 patterns rather than borrowing someone else’s. A cost that looks alarming in isolation often makes complete sense once you can see it against your own account’s seasonal rhythm. This is easier to sustain with the right tooling: an AI Agency Dubai style setup can automate the trend-tracking and flag deviations from your own baseline as they happen, instead of waiting for a monthly report to catch a cost spike after the fact.
It’s also worth building demand outside the paid auction for exactly the windows when CPMs spike hardest. Pairing paid tracking with a GEO Agency approach to organic and AI-search visibility means Ramadan and Q4 don’t have to be paid-only battles — some of that seasonal demand can be captured without bidding into the most expensive weeks of the year.
If you’re evaluating a new agency relationship, ask them to show you real account-level trend data rather than a static industry table — a credible Meta Partner Agency should be able to walk you through how your specific account’s costs moved through the last Ramadan or Q4 cycle, not just recite a generic benchmark sheet. At Meta Social, this trend-level view is standard reporting, not a special request — it’s the same data we use internally to decide where to reallocate a client’s budget before a spike hits, not after.
FAQs
Published figures vary significantly by source and time period, with some placing UAE CPM in the mid-single-digit USD range and others considerably higher depending on placement mix and industry. Rather than anchoring on one number, it’s more useful to track your own account’s CPM trend across a full seasonal cycle.
Costs rise during concentrated high-spend windows — particularly Ramadan and Q4 — when advertiser competition intensifies sharply. Dubai’s advertiser pool also includes large international and luxury brands bidding for the same premium demographic segments many local businesses target, which raises costs for everyone competing in that audience.
Real estate typically carries a higher CPL than most other categories due to the high value and longer consideration cycle of the purchase. A “good” CPL depends heavily on your deal value and close rate —
the more useful benchmark is your own cost per lead relative to your closing economics, not an industry-wide figure.
Published CPC figures for the UAE vary by source, industry, and season, with notably sharp swings around Ramadan and Q4. Rather than relying on a single quoted number, it’s worth tracking your own CPC trend over time, since the market has shown itself to be considerably more volatile month-to-month than global averages.
The UAE market has shown a choppier pattern than steady year-over-year growth — sharp seasonal spikes followed by equally sharp corrections, rather than a smooth upward trend. Whether costs are “rising” for your account depends more on your specific category and season than on a single market-wide direction.
Real estate, finance, and legal services consistently rank among the highest cost-per-click and cost-per-lead categories, reflecting their higher transaction values and more competitive advertiser bidding.
Categories like apparel and food and beverage typically sit at the lower end, given shorter consideration cycles and lower per-transaction value.
Key Takeaways
- Published UAE Meta Ads benchmarks disagree significantly across sources — treat any single figure as a directional range, not a fixed number.
- Ramadan and Q4 are the two most reliable cost-spike windows in the UAE market and should be planned around explicitly.
- Industry variation within the UAE market is typically wider than the gap between UAE and global averages — compare within your category, not against a blended figure.
- The most reliable benchmark is your own account’s trend across a full seasonal cycle, ideally paired with organic visibility to soften the highest-cost windows.
Meta Social — Dubai’s #1 Performance Marketing Agency
Meta Social builds media plans around each client’s own seasonal cost curve — not a published benchmark table — so Ramadan and Q4 spikes are planned for, not survived.
Performance Marketing | SEO & GEO | AI Creatives & Video | Attribution Architecture metasocial.ae | Dubai, UAE
About Meta Social
Meta Social is Dubai’s leading performance marketing agency and the GCC’s AI-native growth partner. We specialise in Performance Marketing, SEO & GEO, AI Creatives & Video, and Attribution Architecture — managing AED 50M+ in paid media across real estate, fintech, e-commerce, and hospitality.
META SOCIAL — DUBAI’S PERFORMANCE MARKETING & AI-NATIVE GROWTH PARTNER