
Meta Ads Manager UAE: The 9 Metrics
That Actually Predict Revenue
Direct Answer
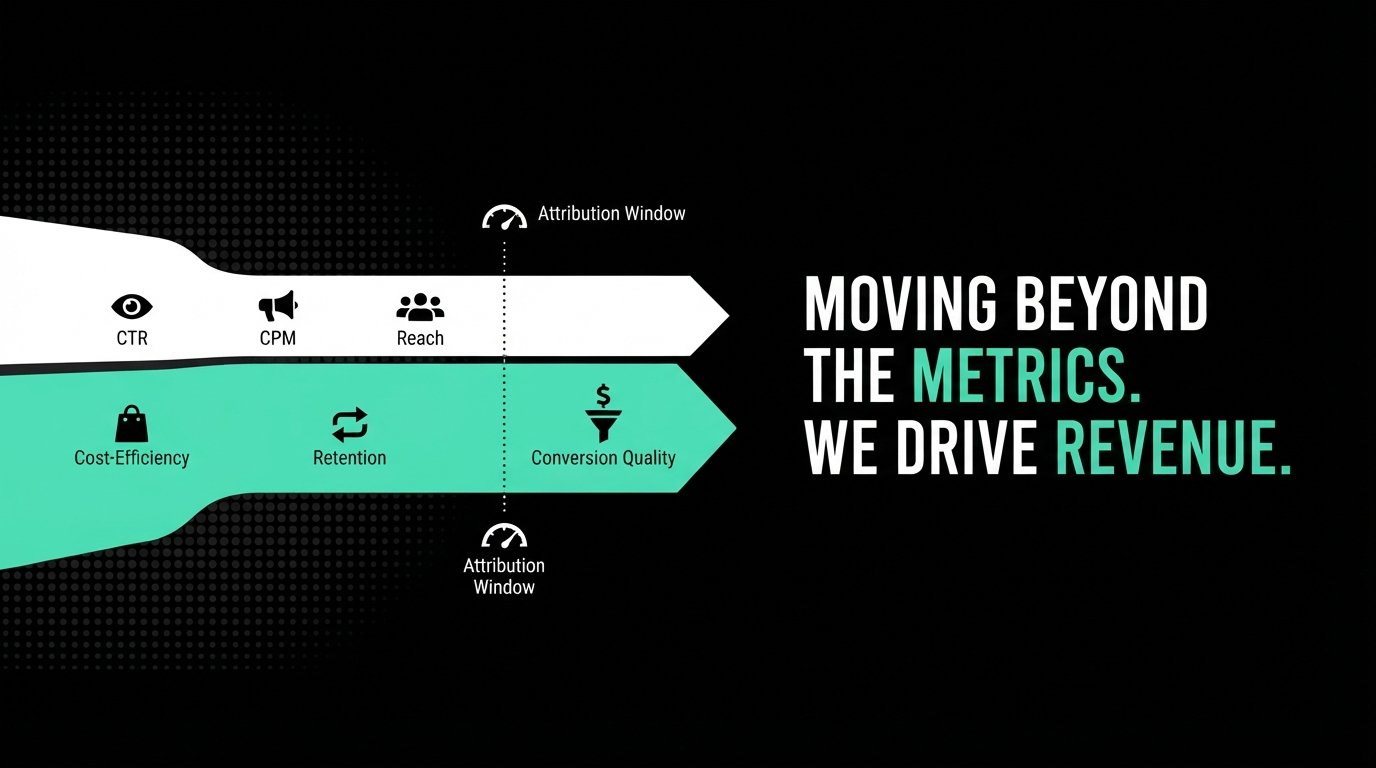
Most businesses track the metrics Ads Manager surfaces most prominently — CTR, CPM, reach — which measure whether Meta can find and engage an audience, not whether that audience actually buys. A campaign can post excellent CTR and still lose money. The metrics that genuinely predict revenue sit one layer deeper: cost-efficiency metrics and post-click conversion quality. Before ranking any of these against each other, it’s also worth confirming your attribution window settings, since two accounts “comparing ROAS” can be measuring fundamentally different things if their windows differ — the setting changes what the number even represents before you’ve compared anything at all. This is one of the first things we check on any new account handover at Meta Social — a misread attribution window has quietly inflated or deflated more “ROAS” numbers than any actual campaign problem.
Why the Headline Metrics Mislead
CTR, CPM, and reach describe delivery efficiency — how cheaply and widely Meta is distributing your ad. They say nothing about what happens after the click. A high CTR can just as easily indicate curiosity-driven clicking that never converts as it can indicate genuine purchase intent, and a low CPM can simply mean you’re reaching a large, low-intent audience cheaply rather than reaching the right audience efficiently.
This matters because these are the metrics Ads Manager’s dashboard surfaces most visibly, which quietly trains businesses to optimize for what’s easy to see rather than what actually matters. A Meta Ads Agency reporting primarily on CTR and reach to a client, without connecting those numbers to downstream conversion quality, is telling a partial story.
The Nine Metrics Worth Actually Tracking
Grouped by what they reveal:
Delivery signals (context, not verdicts): CPM and CTR — useful for diagnosing whether an audience or creative is fundamentally reaching people and generating interest, but not conclusions on their own.
Cost-efficiency metrics (the real diagnostic layer): Cost per lead or cost per purchase, cost per add-to-cart, and frequency — these tell you what you’re actually paying for outcomes, and whether your existing audience is being over-served the same creative.
Conversion-quality metrics (where revenue actually lives): Conversion rate from click to purchase or lead, average order value or lead value, ROAS calculated against a consistent attribution window, and — for lead generation businesses specifically — lead-to-customer conversion rate tracked outside Ads Manager entirely, since Meta has no visibility into what happens after a lead form submission reaches your sales process.
That last metric is the one most UAE businesses skip entirely, and it’s often the biggest gap between what Ads Manager reports as “working” and what the business actually experiences in revenue.
The Attribution Window Problem Nobody Checks First
Before ranking or comparing any of the metrics above — especially ROAS — confirm what attribution window your account is set to. Meta allows different click and view-through windows, and changing this setting changes what counts as a conversion for reporting purposes, without changing anything about the actual campaign delivery. Two businesses casually comparing “our ROAS is X” may be comparing numbers built on entirely different underlying math, not different campaign performance.
This is a genuinely underrated diagnostic step. A Performance Marketing Agency handing over a ROAS figure without specifying the attribution window it was calculated under is giving you a number that’s difficult to trust or compare against anything else, including your own historical data if the setting has ever changed. A genuine Meta Partner Agency typically has access to more granular attribution and reporting tools than a standard ad account, which makes catching a misconfigured window before it distorts months of reporting easier — one more reason Partner-level access matters beyond platform support alone.
Building a Simple Weekly Dashboard
Rather than trying to monitor every available metric daily, a workable weekly rhythm looks at cost per result against your target, frequency (watching for a climb that signals creative fatigue setting in), and conversion rate trend from click through to your actual revenue event — not just the platform-reported conversion, if your sales process has its own downstream steps.
For lead generation businesses specifically, closing the loop between Ads Manager’s reported leads and your CRM’s actual close rate is the single highest-value addition most dashboards are missing. Without it, you’re optimizing for lead volume and cost, which may or may not correlate with the leads that actually become customers. An AI Agency Dubai style workflow can help automate the frequency and fatigue-tracking layer of this dashboard, flagging a climbing frequency before it shows up as a cost spike — though the underlying metrics worth watching stay the same either way.
Metrics Worth Retiring From Leadership Reporting
Reach and impressions, on their own, rarely tell a business leader anything actionable about whether the marketing spend is working — they measure exposure, not outcome. If you’re currently reporting these prominently to leadership, consider replacing them with cost per result against target and a trend line for your true conversion rate, which speak directly to the question leadership actually cares about.
Businesses running a GEO Agency approach alongside paid media should also watch organic-assisted conversions separately from paid — folding organic-driven revenue into a single blended ROAS number obscures which channel is actually doing the work, and makes it harder to know where to reinvest as budgets grow.
FAQs
Cost-efficiency metrics like cost per purchase or lead, and conversion-quality metrics like click-to-purchase conversion rate and lead-to-customer rate, predict revenue far more reliably than delivery metrics like CTR, CPM, or reach, which only measure how efficiently Meta is distributing your ad.
A strong CTR indicates people are clicking, but it says nothing about what happens after — a mismatch between the ad’s promise and the landing page, a weak offer, or low purchase intent among clickers can all produce this pattern. Look at your conversion rate from click to purchase to diagnose where the gap is actually occurring.
This depends heavily on your margin, deal value, and — critically — the attribution window your account is using, since that setting changes what counts as a conversion in the calculation. Compare your ROAS against your own historical baseline under a consistent attribution setting rather than an external benchmark figure.
Beyond delivery metrics, prioritize cost per result against your target, frequency as an early fatigue signal, and conversion rate through to your actual revenue event — and for lead generation businesses, connect Ads Manager’s reported leads to your CRM’s real close rate, since Meta has no visibility past the lead form.
Cost per purchase measures what you’re paying for a completed transaction, typically used in e-commerce. Cost per lead measures what you’re paying for a qualified inquiry or form submission, typically used in service or B2B businesses where the sale happens outside the platform — and needs to be paired with your actual close rate to mean anything financially.
Calculate ROAS against a consistently defined attribution window, and for lead generation businesses, connect it to your actual close rate rather than relying on platform-reported conversions alone. A campaign can look efficient inside Ads Manager and still be unprofitable once real downstream conversion rates are factored in.
Key Takeaways
- CTR, CPM, and reach measure delivery efficiency, not revenue — they’re useful context, not conclusions on their own.
- Confirm your attribution window before comparing ROAS across time periods or against any external benchmark — the setting changes what the number represents.
- For lead generation businesses, connecting Ads Manager data to actual CRM close rates is usually the single biggest missing piece in revenue reporting.
- Replace reach and impressions in leadership reporting with cost per result and true conversion rate trends — metrics that actually answer the question leadership is asking.
META SOCIAL — DUBAI’S #1 PERFORMANCE MARKETING AGENCY
Meta Social checks attribution window settings on every account handover before a single ROAS figure gets reported — the diagnostic step most dashboards skip.
Performance Marketing | SEO & GEO | AI Creatives & Video | Attribution Architecture metasocial.ae | Dubai, UAE
About Meta Social
Meta Social is Dubai’s leading performance marketing agency and the GCC’s AI-native growth partner. We specialise in Performance Marketing, SEO & GEO, AI Creatives & Video, and Attribution Architecture — managing AED 50M+ in paid media across real estate, fintech, e-commerce, and hospitality.